 Enhance your cybersecurity
visibility and posture with xMDR
Enhance your cybersecurity
visibility and posture with xMDR
xMDR provides you visibility for your company across your existing technologies enabling your cybersecurity management teams to proactively and reactively identify and neutralize threats.
Talk to an expertStruggling with cybersecurity threat detection and response?
Meet Cipher xMDR, our holistic cybersecurity for business solutions that protects your organization from cyberthreats through an AI-driven approach and advanced data analytics.
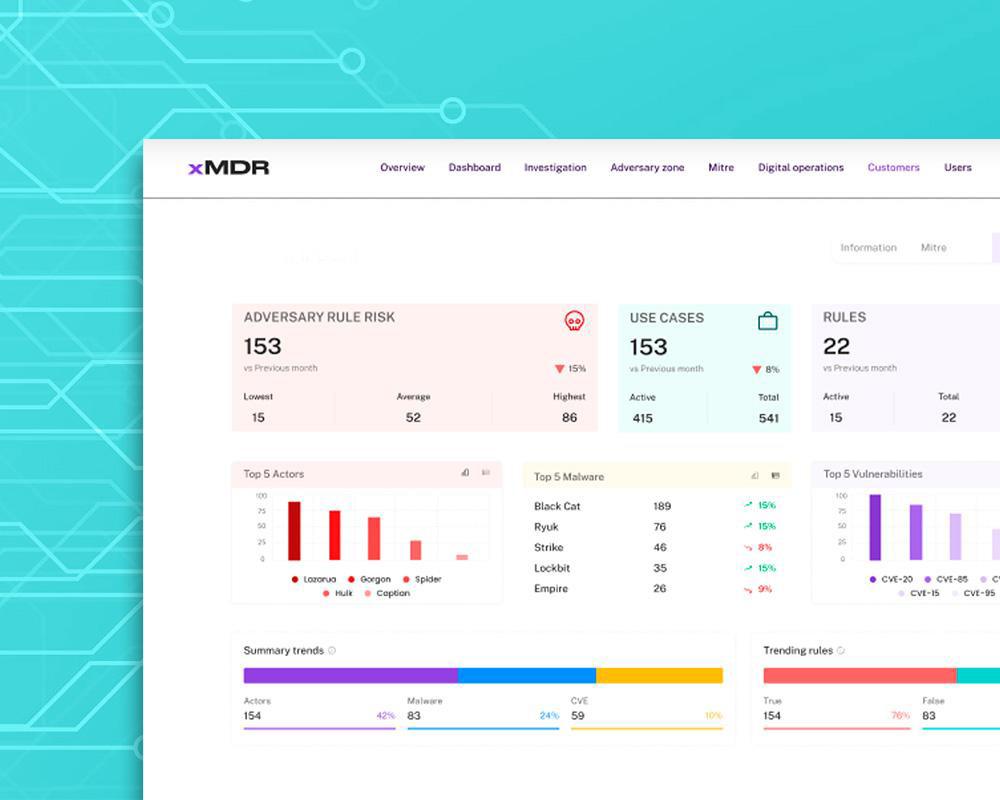
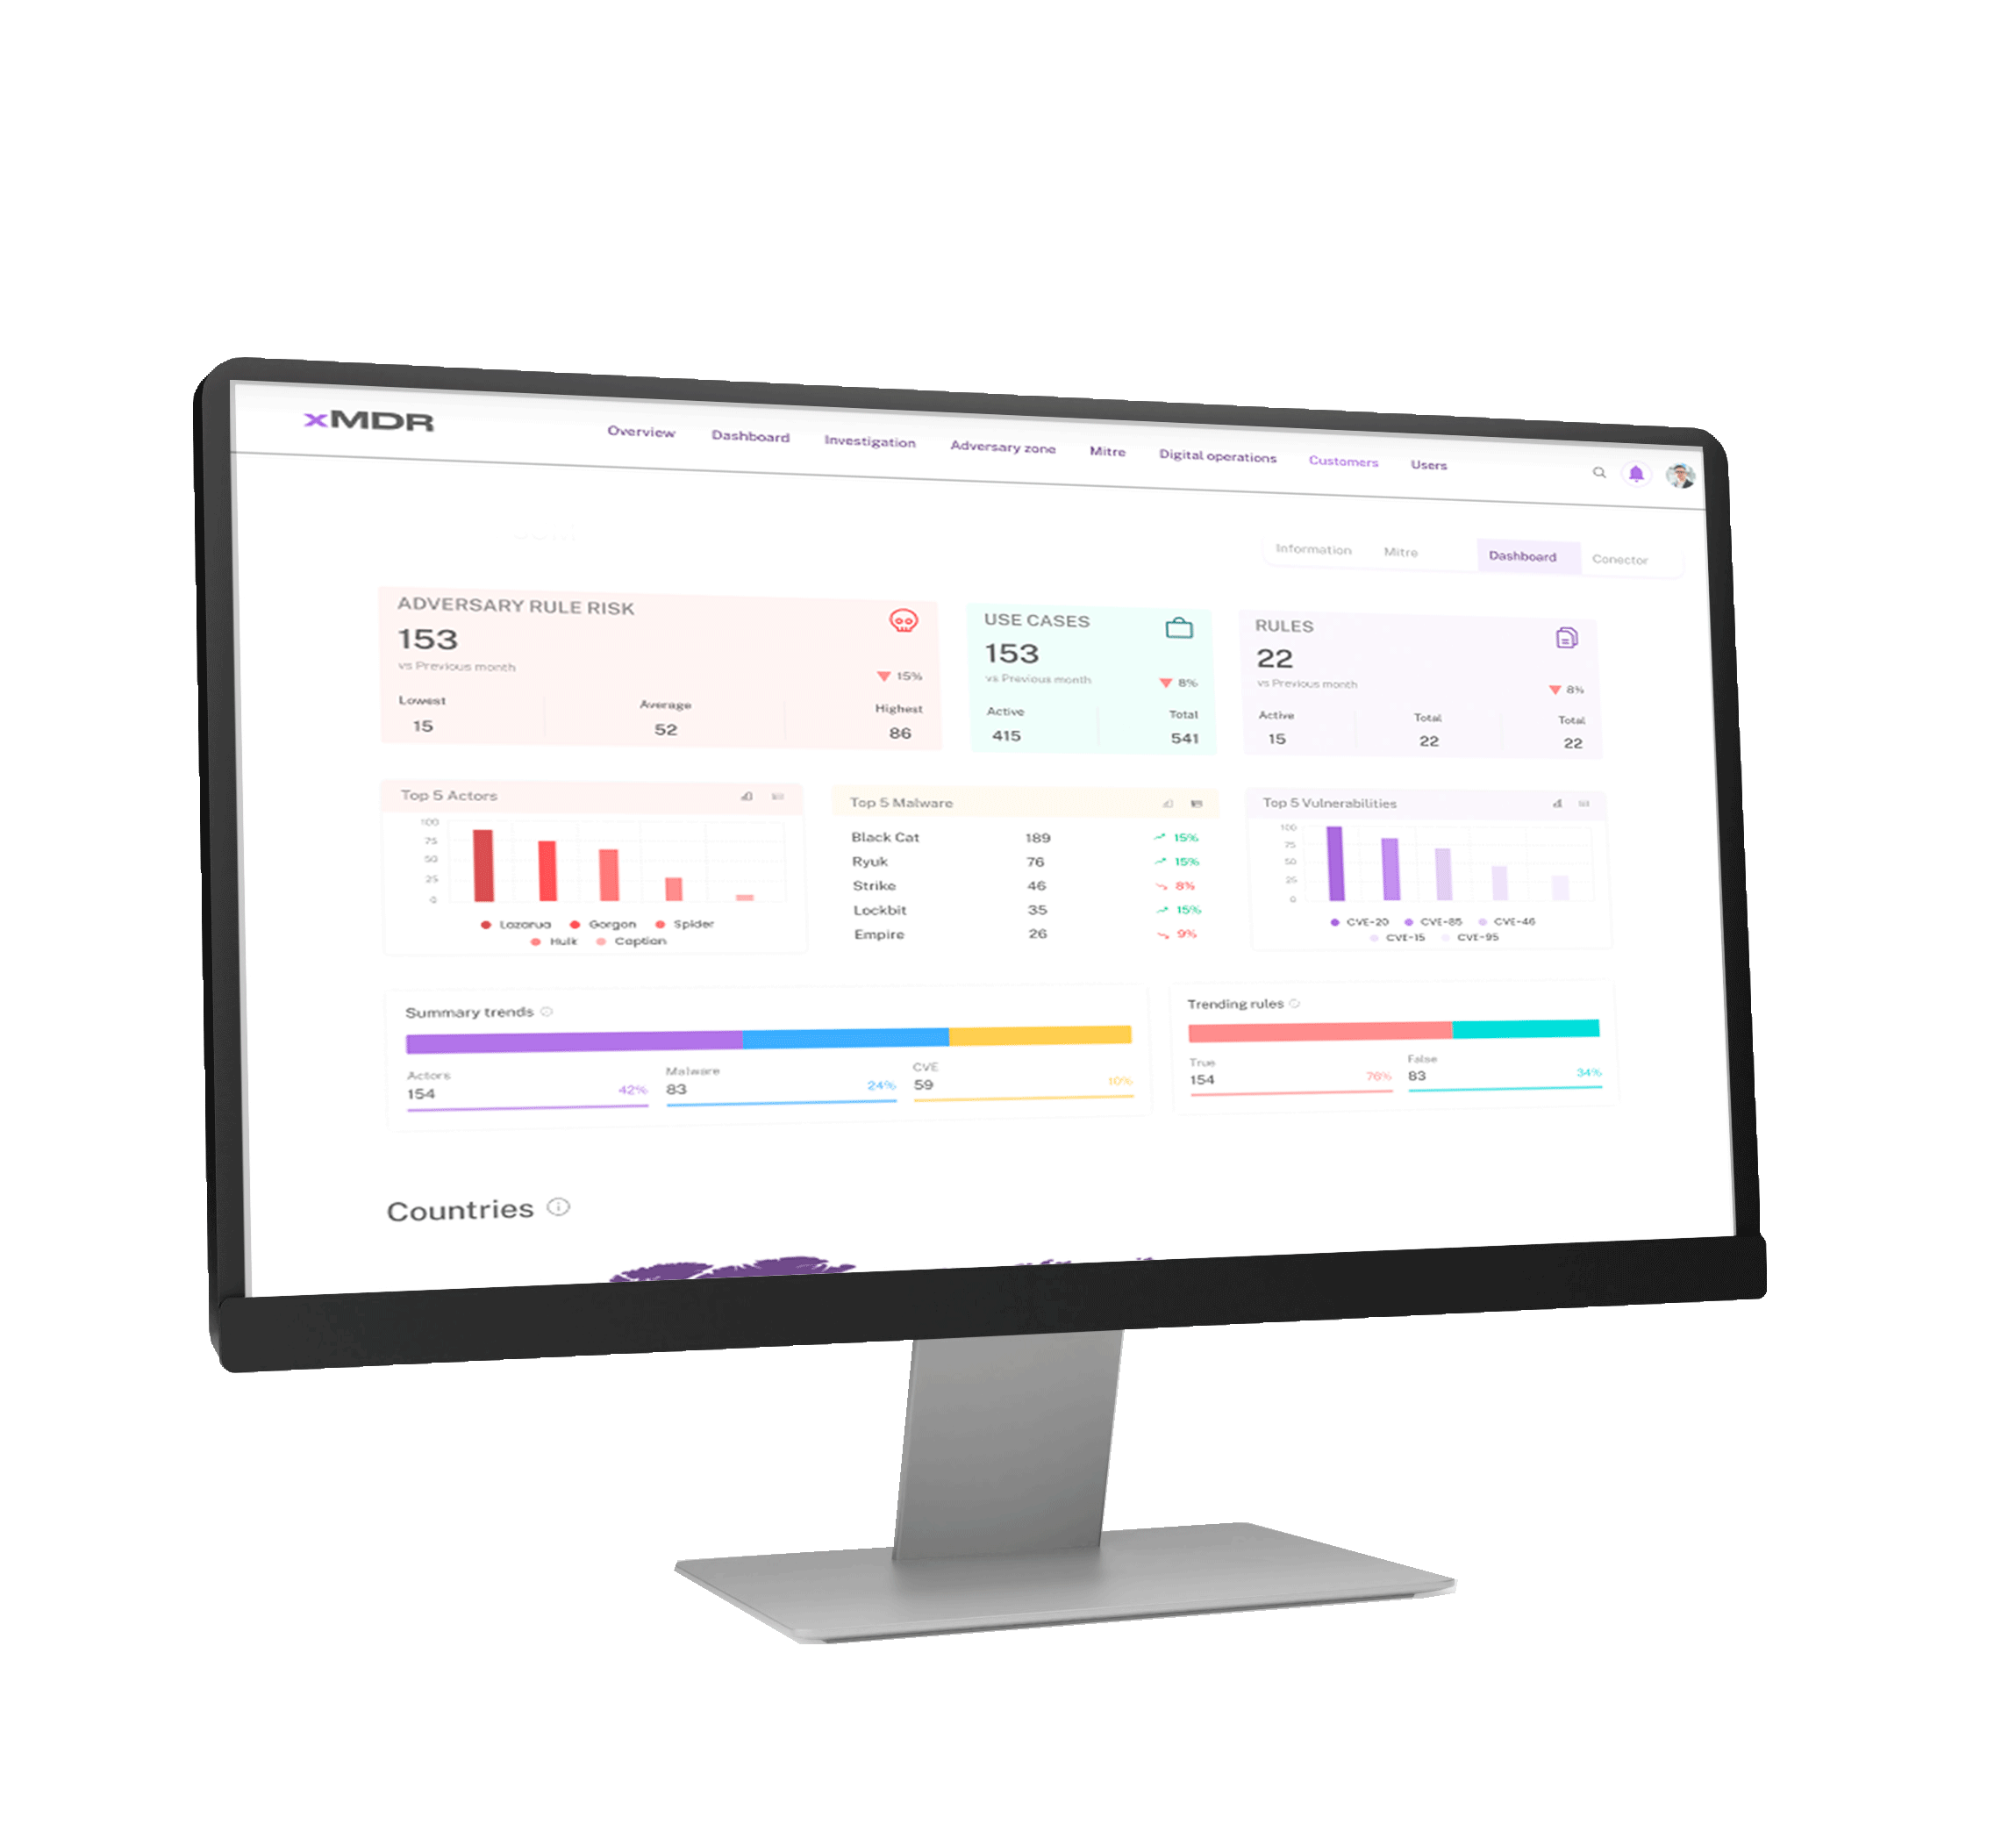
.png)
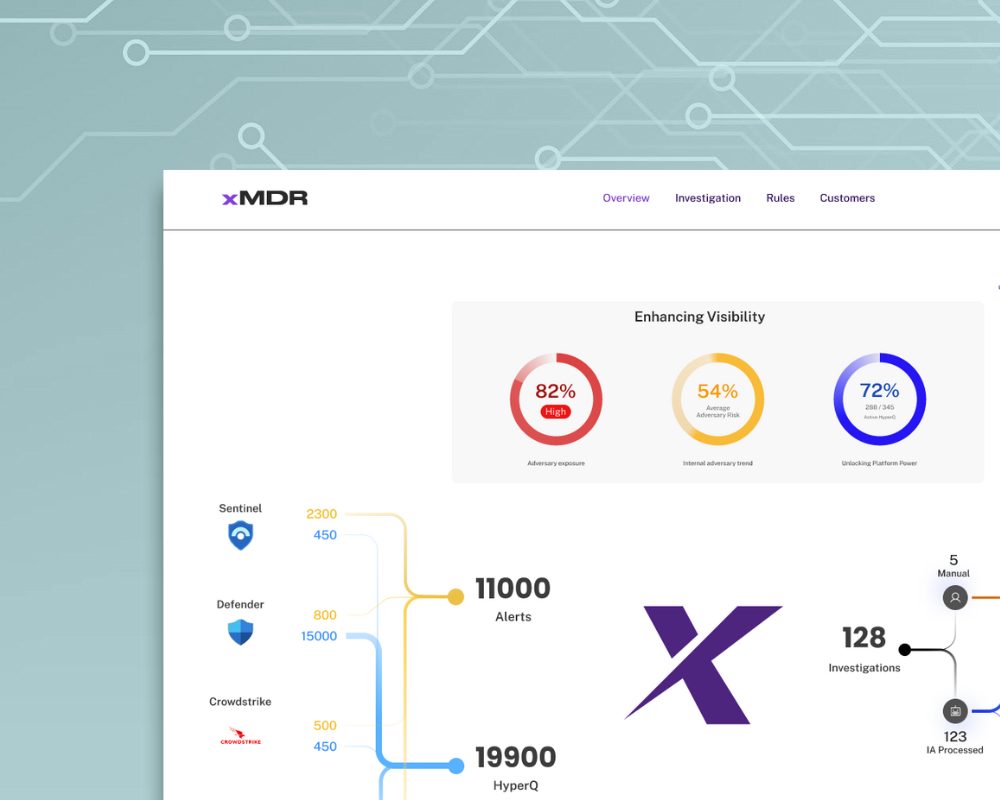
Discover how Cipher xMDR addresses your business concerns

Fragmentation Management
Deploy cipher xMDR as an umbrella on top of your existing technologies to break silos in capacities and configurations thus ensuring unified cyber protection and criteria.
Closing Visibility Gap
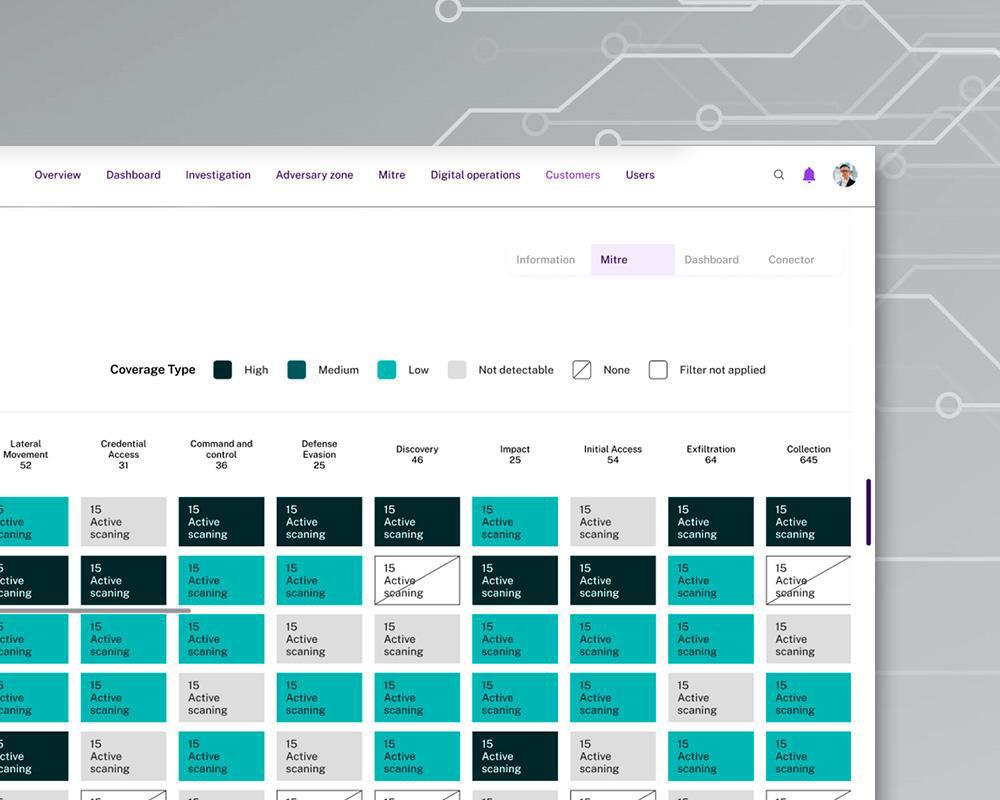
Gain complete asset visibility and posture in a unified portal view for detection and response covering IT, OT, Cloud and On premises.
Bridging Talent Gap
xMDR makes extensive use of AI and automation of repetitive tasks to allow your analysts to better perform their duties, no more time wandering systems or documenting tickets.
Adapting to Continuous Evolution
Cipher xMDR tracks your activity and the activity of those who are looking after your data adapting the protection. We got you covered.
Optimization Against Cost Constraints
Cipher XMDR connects to your existing stack (or stacks) without requiring additional tools, offering a cost-effective, cloud security solution.
Deploy efficient and effective cybersecurity to cover business needs
x5
Increase in Detection Surface.
100%
Managed Alerts.
20 days
Full Service in Production.
24/7
Operations in 6 SOC.
Up to 50%
TCO Reduction.
99,99%
Service
Availability.
What results should you expect with xMDR?
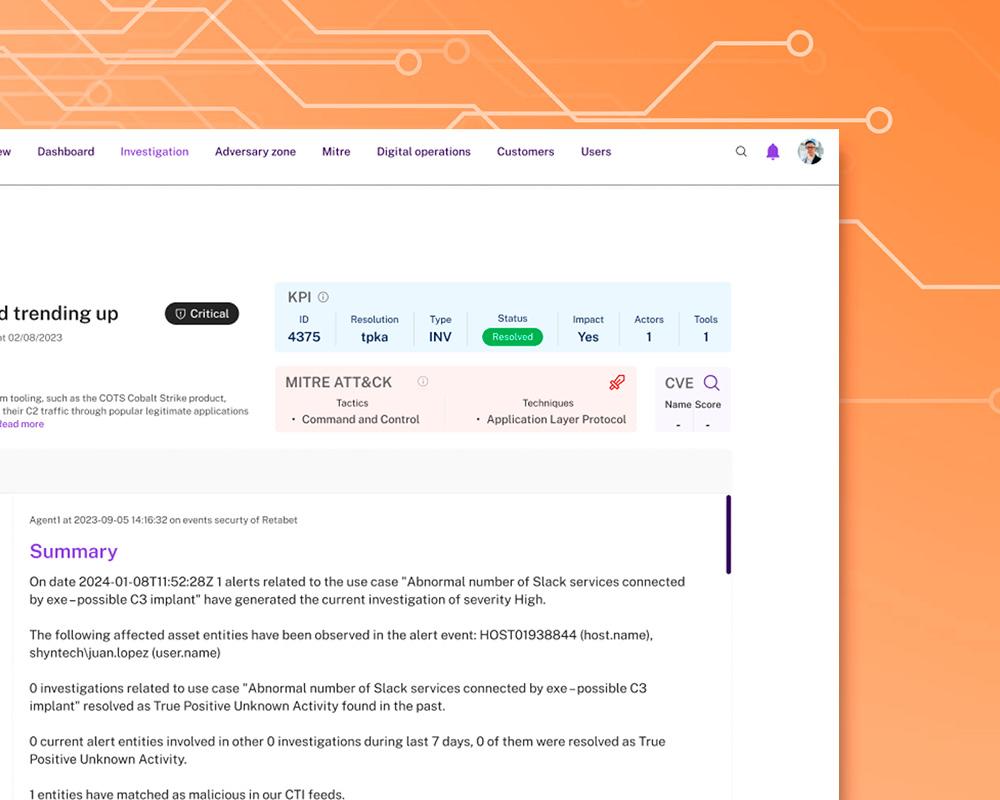
Super fast deployment / no changes in tech stack, reactive and proactive alerting, continous threat hunting and vulnerability assessment. With xMDR you can achieve enriched investigations, reduced alert fatigue, and AI-powered recommendations for your analysts, making cybersecurity management more effective and efficient.
.svg)
How our clients improve their cybersecurity with xMDR

xMDR Platform
Explore how the xMDR Platform enhances information security and transform your business into a more profitable and efficient enterprise.
xMDR is AI-Driven
Generative AI has come to stay, at xMDR AI is at the core. Involved in more than 10 use cases from Adversary Profiling to analyst recommendations crossing thru development of rules or predicting the kill chain.


PCI-DSS
With over 20 years of experience in PCI-DSS (Payment Card Industry Data Security Standard) compliance, we ensure that your company manages credit card information within a secure and compliant environment.
Stay up-to-date with the latest in cybersecurity

Unit x-63 Resources
Read about the latest regarding Actors Campaigns and trends and how to counteract.

Cipher Blog
Stay updated with our blog on the latest cybersecurity news and trends.
Ready to take the next step?

Talk to an expert
Please provide us with a bit more information so that the right person can reach out.

Free assessment
Get a free analysis of your organization profile from a thread modeling perspective, ensuring robust cyber protection and data protection.